Primer on Signals
Prerequisites:
- Trigonometry
Let's talk about signals...
Pfft... yeah signals, as if I don't know about it...
..... You don't, so stick around if you don't know what wave-components, sawtooth waves, triangle waves, sine waves mean.
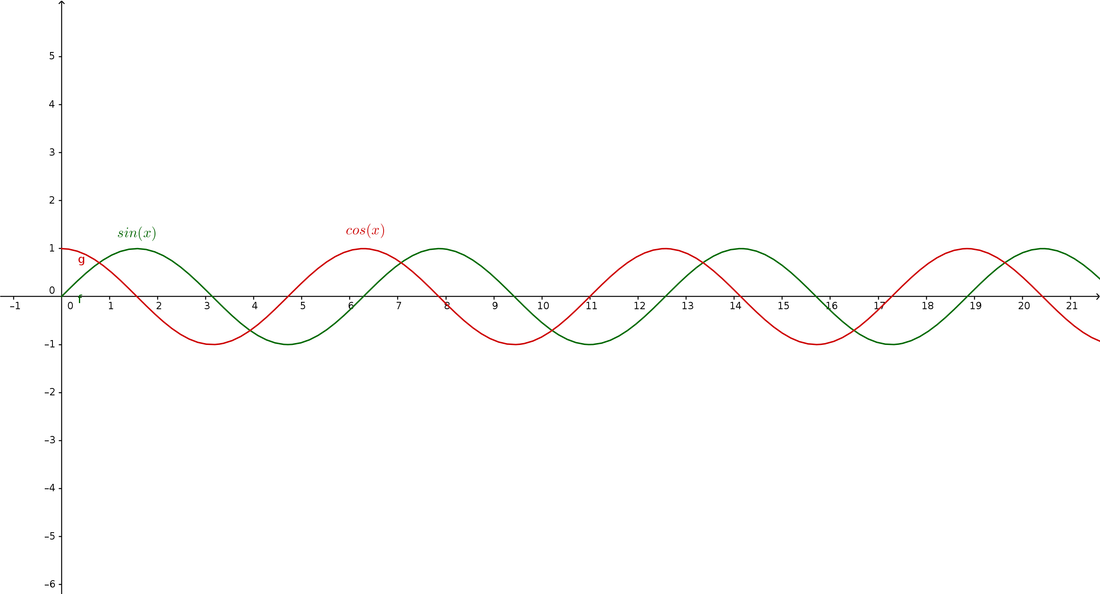
So let's star with the most simple wave signal of all. The only reason it's named this way (as are all of the rest of the signals) is becuase it looks like it when mapped with time. You should remember the below diagram from my trigonometry primer-
Remember those shapes even if you die, they're gonna be THE most important voltage you'l be working with that'll involve math.
So, to state it properly- a sine (or rather a sinusoidal, meaning sine-like) wave is a voltage that's defined like this-
$$V(t) = V_{amp}sin({\omega}t)$$
or
$$V(t) = V_{amp}cos({\omega}t)$$
Why are there 2 definitions? Simply because the $cos({\omega}t)$ and $sin({\omega}t)$ waves are going to have literally the same shape, just shifted a bit, and this is called "phase-shift", a term you should remember. Another thing you should remember is that the $cos$ wave is $\frac{\pi}{2}$ ahead of the $sin$ wave (which basically means that $\frac{\pi}{2}$ is the phase shift and it's literally added to the $sin$ wave's angle to get the $cos$ wave).
Also, $\omega$ is called the "angular frequency", which is how fast a sine wave completes one wavelength. If it's large, the wave will have tons of wavelengths (wavelength btw, is the "distance" between 2 adjacent maxima (the maximums) or minima (the lower minimums)), and if low, you'll see a large wavelength spread over a lot of time. There's a lot more to this. Especially in terms of math, but I think it would be better to explain them as they come.
And before we start the rest, let's talk about fourier theory, it's not gonna have any math, but it's useful to have around while thinking.
Fourier theorem basically means that every single wave you can possibly imagine is a sum of sine waves. Each of the sine waves are called its components. When you hear someone talking about the component frequencies, it's the frequencies of these sines waves that they're referring to. It's usefulness will be visible once we start learning about RC and LC networks, and every other circuit, with any kind of changing signal. With that in mind, let's explore a few signals.
Square Waves:
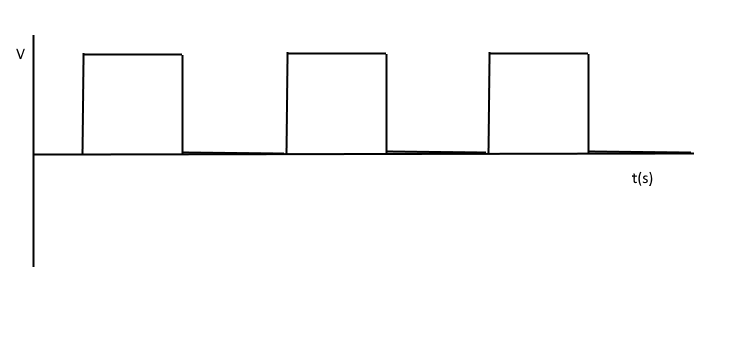
This is gonna be either the most or the second most frequent waveform you'll be working with, depending on whether digital is your thing, or analog is. Either way, it's really important, but there's not much to it. It, unsurprisingly, looks like this -
That's, uh, boring. Yup, totally. It's just a few bits represented as voltage. You can consider the "highs" of the wave as 1 (also known as HIGH, for obvious reasons), and the "lows" as 0. The opposite is again possible. Why? Well, there are reasons, but I'll explain that down the road. But that's all that a wave like this can represent. You should remember that this is a periodic, such stuff is *ahem* square (pardon the terrible pun ;P), but non periodic ones are just as common. The below discusses properties that to be exact is only about the periodic ones, but work well as an approximation for non periodic ones too.
The formula for the square wave is -
$$V = \sum^{\inf}_{i = 0} \frac{1}{2i + 1}sin((2i + 1)t)$$
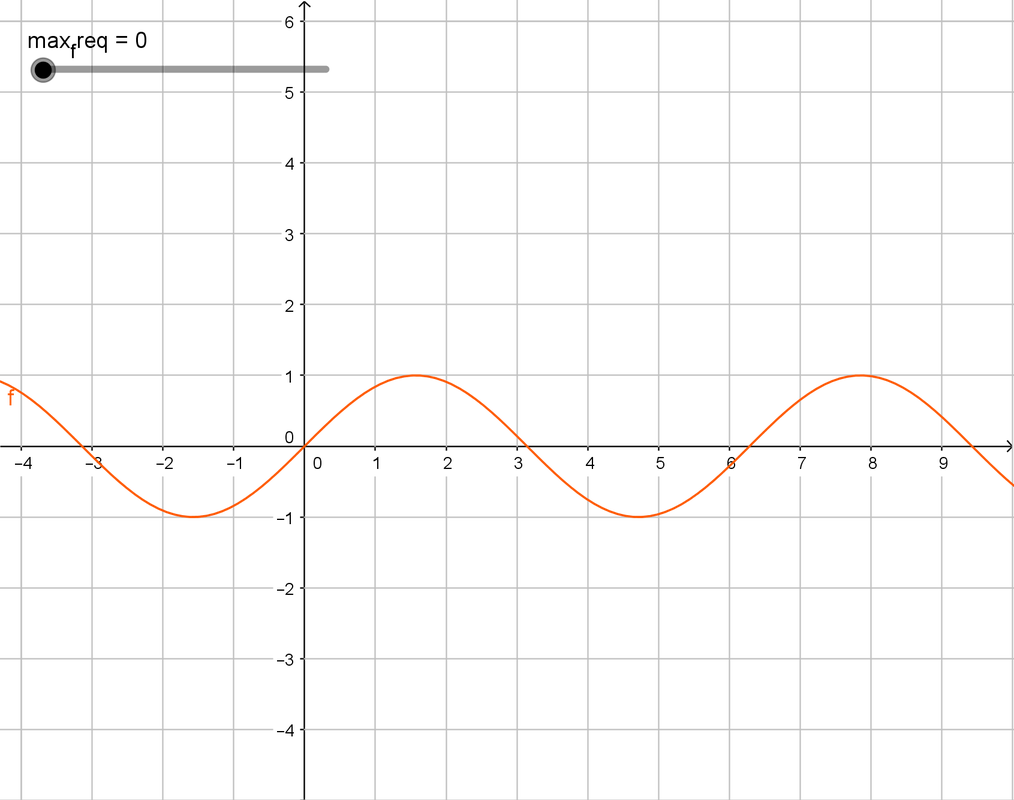
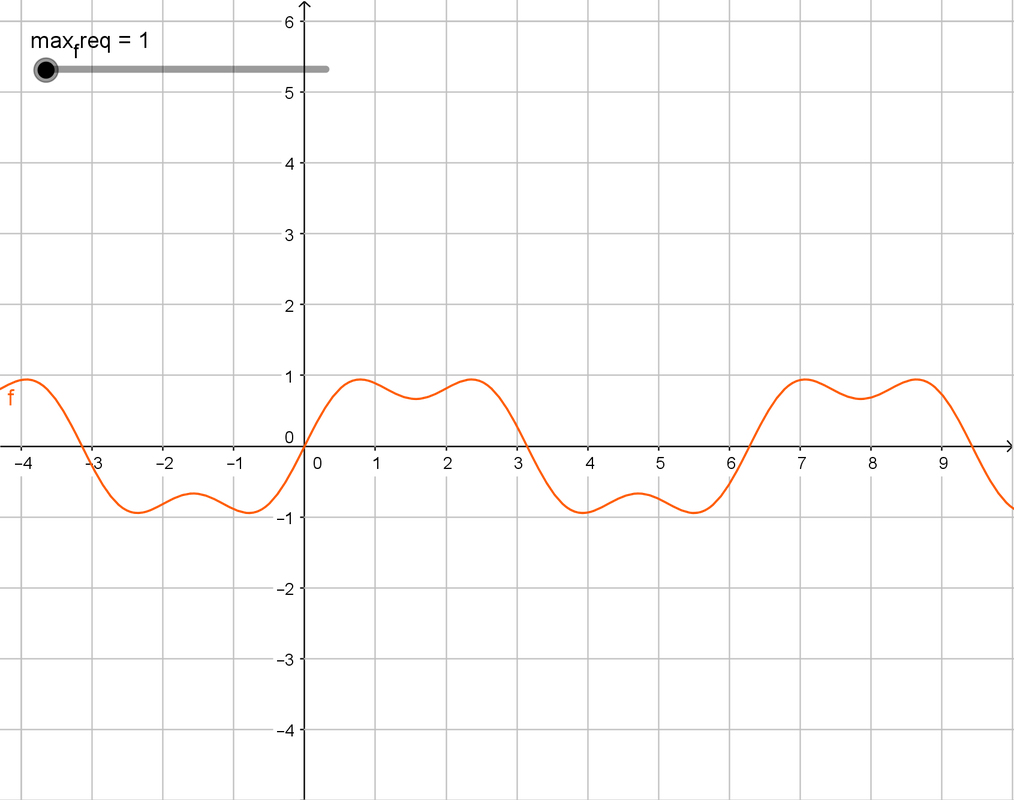
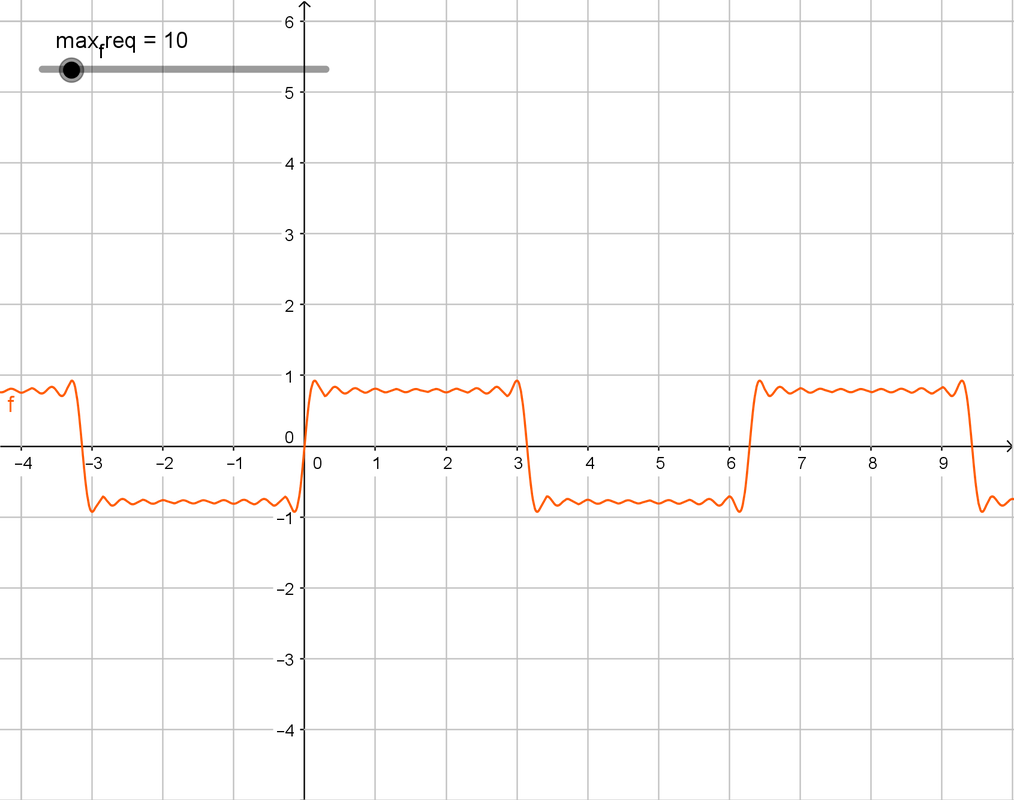
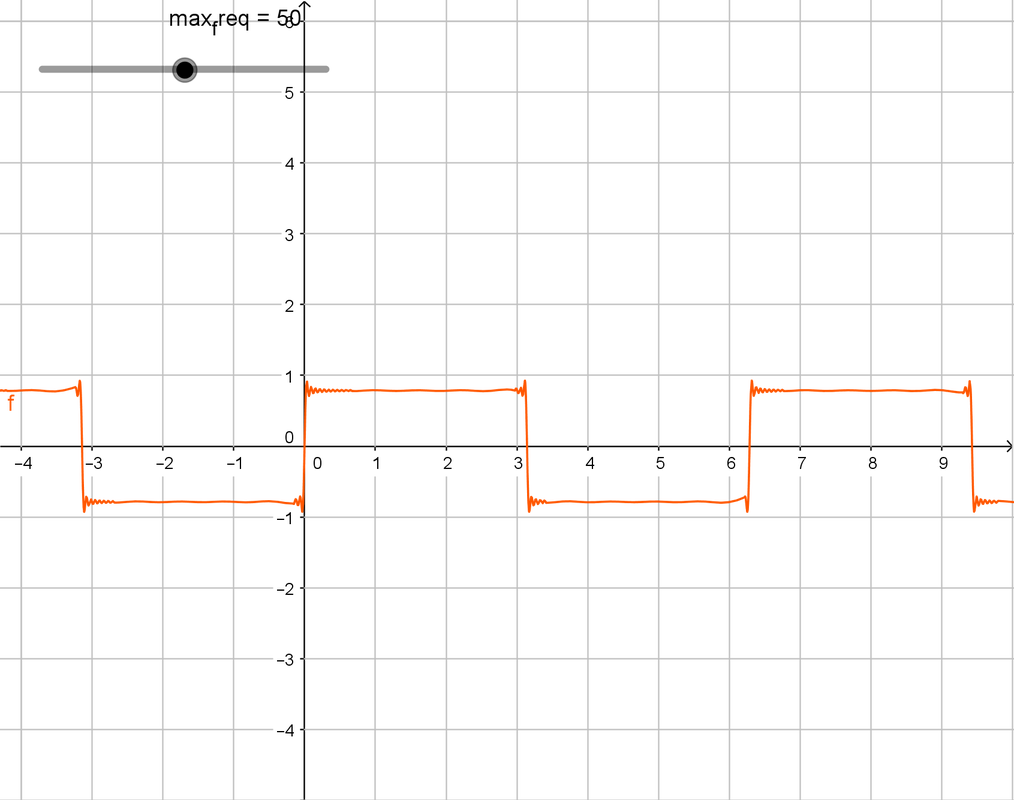
I know, that's unusually complex. It's pretty interesting, in fact. And if you're smart, then you're eye should've caught the $sin((2i + 1)t)$ part. It might be hard to understand, but visualization should help. This is what you get when $i$ varies -
Here max_req is upper limit $i$. The first graph is, well, a sine wave, pretty easy to predict from the above fromula. The second one is pretty curvy. Te third one is where we can see the actual square wave, and the fourth one is pretty damn square. It's square enough for any practical application (pun totally intended).
But what can knowing that have anything to do with practical applications? Well, you'll have to wait for my next tutorial. For now, let's move on.
Triangle Wave:
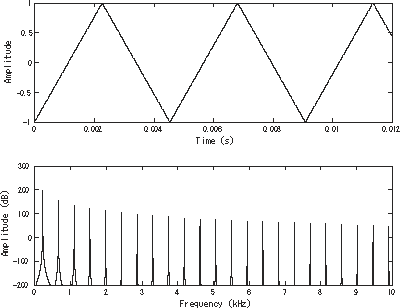
The triangle wave is not common. It's common place in the old 8 bit consoles for making music (the NES, for example), but really, it's not anything special, and not really encountered in the real world, so, meh. But it should be known, because it's common knowledge with EEs, at least, if you want to effectively communicate online.
That's it.
And now for the last type of signal -
Sawtooth Wave:
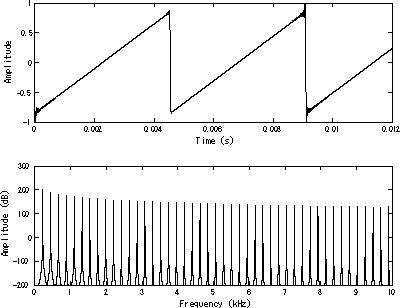
This is also a wave that's damn similar to the triangle in its importance. It's used in very specific areas. Here's a picture (wohoo)
And now for the last type of signal -
Sawtooth Wave:
This is also a wave that's damn similar to the triangle in its importance. It's used in very specific areas. Here's a picture (wohoo)
And that finishes this primer. It was pretty boring, but the next one is gonna be fun, I promise
